A micro-cap IPO is being launched in Singapore and is expected to be listed on 3 November 2016. The company in question is HC Surgical Specialists Limited (“HCSS”). As I have mentioned previously in a post on Advancer Global’s IPO, I almost always avoid IPOs but HCSS’ pricing gives a lot to pause for. The valuation seems undemanding, especially when compared to its peers in the healthcare sector listed on the SGX, which are trading at obscene multiples.
The key details extracted from the Offer Document, which can be found on here, are as per below, which would paint a picture of why I believe it is rather undervalued and represents a good opportunity to mop up some shares. That is if I can even get my hands on it on the day of trading, given that the IPO is a full placement – no shares offered to the general public via balloting and there is a strong likelihood the share price will shoot up so quickly at the opening bell it won’t make sense to buy at an elevated valuation.
Below is a quick and dirty assessment of the IPO, the business and its valuation.
About the business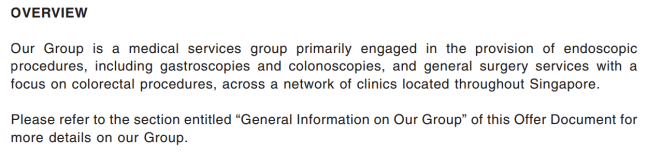

Placement price per share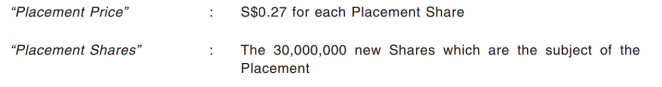 Market capitalisation and number of shares outstanding
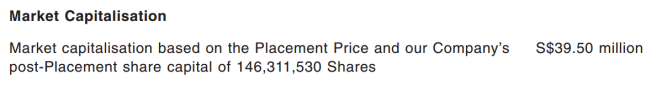
Normalisation
Past 3 years’ results and pro forma numbers for FY2016
Tax rates, government grants and FY2014’s and FY2015’s profit
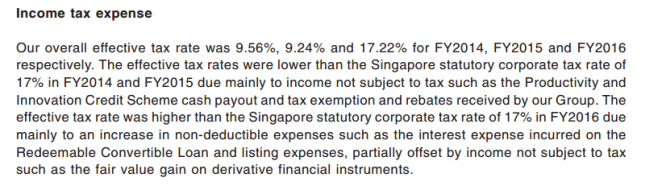
The tax rates for FY2014 and FY2015 were abnormally low due to tax incentives which may not accrue going forward. To be conservative, I would adjust the profit for both years by the normalised and standard statutory corporate tax rate of 17%.

In addition, government grants under ‘Other income’ may not be a guarantee going forward, and as such, should be deducted to normalise historical earnings.
Deducting the government grants and applying the 17% tax rate would mean that FY2014’s and FY2015’s net profit would have been S$3,168,974 and S$2,792,090 respectively.
Normalising FY2016’s figures
The company incurred listing expenses of S$430,000 which will not be repeated in future years (other than in FY2017 as the IPO crosses over the time period). It also generated fair value gain on derivative financial instruments of S$366,049 and finance costs of S$444,029 arising from its redeemable convertible loan which are non-recurring (other than in FY2017 as the IPO crosses over the time period).
By normalising the above 3 components, deducting government grants of S$52,683 and applying a 17% tax rate, we would arrive at FY2016’s normalised profit of S$3,153,694.
To summarise, normalised net profit for the last 3 financial years are:
FY2014: S$3,168,974
FY2015: S$2,792,090
FY2016: S$3,153,694
Estimated profit for FY2017

To have a rough gauge of how the numbers are going to look like going forward, I take the pro forma numbers up till the profit before tax line of S$4,032,259. This figure assumes acquisitions done after the FY2016 year end (31 May 2016) were taken into account, among other line items as per the adjustments above.
Some figures that need to be adjusted include the total fair value gain on derivative financial instruments, finance costs, listing expenses, government grants as mentioned in the previous section’s ‘Normalising FY2016’s figures’.
In addition, there will be expenses incurred in relation of HCSS being a publicly-listed company. These include director fees, Catalist sponsor fees, fees payable to SGX, etc. For larger businesses, there is often sufficient buffer to take on those costs, but since HCSS is in the micro-cap space, let’s have a quick look as to whether it will create a large enough dent in earnings to warrant attention.
- Directors’ fees – There are 3 additional directors, excluding Dr Heah Sieu Min and Dr. Chia Kok Hoong who are part of management. The 3 are non-executive directors and are expected to be paid between S$0 up to S$250,000 per annum as per the Offer Document. That is a little too vague and would probably be better represented by Hay Group’s study in 2015 on non-executive directors’ average remuneration of S$60,000 per annum for Singapore-listed companies. With 3 directors, that adds up to an estimated S$180,000 of expenses estimated to be incurred by HCSS for FY2017
- Sponsor fees – There does not seem to be publicly available information on fees paid to continuing sponsors for Catalist-listed companies. I believe it should be safe to assume S$15,000 per month which totals S$180,000 per annum
- Fees payable to SGX – As per SGX’s website, “Catalist listed equity securities are subject to a minimum fee of S$15,000 and a maximum fee of S$50,000 based on S$25 per million dollars or part thereof of the market value.” Since the market cap of S$39.5m translates to just S$987.5, it is safe to assume the fee it will be paying to SGX will be S$15,000 per annum for the foreseeable future
There will definitely be additional costs involved such as the printing of fanciful glossy annual reports and booking of function rooms and catering for EGMS and AGMs. I assume setting aside S$50,000 per annum should be sufficient. Adding all the items up, we have ongoing costs of about S$425,000 per annum.
Assuming all other revenue and costs stay the same for FY2017 and adjusting for all the line items mentioned above, we get a profit before tax of S$3,704,918 while net profit based on a 17% tax rate gets us to S$3,075,082 or 2.10 cents per share (based on post-Placement shares of 146,311,530).
Cash flows

There doesn’t seem to be much of accounting gimmicks, given that operating cash flows have exceeded net profit in FY2014 and FY2015 out of the last 3 financial years. The reason it dipped below net profit in FY2016 is due to changes in working capital which isn’t much of a concern in this case (specifically payment of trade and other payables).
Capital expenditures are rather reasonable at S$337,357, S$406,005 and S$192,501 respectively for FY2014, FY2015 and FY2016 respectively compared to close to 10x the operating cash flows the business generates.
The average free cash flows across the 3 past financial years match very closely to that of the average net profit – a good sign of investors’ ability to rely on the income statement.
ROIC
My initial guess is that the nature of the medical business is such that it doesn’t have to employ much capital to generate good returns since most of the work done or value stems from the intangible skills and reputation of the doctor. The quality of tangible equipment definitely plays a part but I would argue that the importance of the person utilising the machines ranks higher.
Going deeper into the numbers, invested capital (equity + debt, redeemable convertible loans, derivative financial instruments – cash) for the financial years are:
FY2014: S$421,775
FY2015: -S$123,312
FY2016: -S$1,557,687
Clearly, HCSS is a superior business given that it doesn’t need much invested capital and runs on negative invested capital in FY2015 and FY2016 to operate and churn cash out. That pretty much leaves ROIC (normalised net profit) for FY2014 as a ridiculous 751% while not being applicable for FY2015 and FY2016.
Moats
The moat appears to be intangibles – brand, which is pretty much dependent on the doctors’ skills and reputation. I don’t exactly like the idea of the main moat being dependent on the persons running the show, which in this case appears to be Dr Heah and Dr Chia. If they get hit by a bus, would that effectively mean game over for the business? The good news is, there are 2 other surgeons within the group, 4 external surgeons who run their own practices with fee-sharing arrangements and 2 other general practitioners. I wouldn’t say the moat isn’t strong for now, not until they have created a brand name for the practice that will outlive the reputation of the individual doctors (think the Mayo Clinic, Q&M and Raffles Medical).
The Offer Document listed ‘we have multiple clinics located in highly accessible locations’ as one of its competitive advantages. I personally think it is a nice to have but would not represent a strong advantage. Granted, the operating costs are lowered given the cheaper rental in the heartlands where HCSS has a presence but it represents just 3 (Hougang, Bukit Batok and Tampines) out of 11 facilities on hand. The rest of the facilities are in the usual higher rent central hospitals like Mount Elizabeth and Gleneagles. In addition, my opinion is most people will view specialists located in top notch and well-known medical centres as much more reputable and are willing to pay the premium that comes with it. After all, medical expenses are not exactly line items you would want to cut down on when it concerns your health. I would even argue that having a specialist clinic located in the suburb may lower the brand equity of the overall group.
Growth
The Offer Document talks about the company’s prospects and strategy towards growth as per below:

I generally agree with the prospects and growth plans wise, in most cases I discount it a fair bit, particularly on overseas expansion in Vietnam since that also brings a whole set of risks.
I would say for businesses such as this where it’s practice-based rather than owning a hospital outright which provides a certain untapped capacity to grow the business, more often than not, a rollup strategy to acquire other practices is likely to be the name of the game. There are only so many patients a doctor can perform on a procedure a day. In other words, it doesn’t quite have the economies of scale in the sense of the scalability that allows software companies make money. Granted, the roll up strategy is riskier than organic growth, it isn’t too bad a strategy and the nature of the business sort of forces the dynamics of a rollup strategy. After all, with all the gushing operating cash flow generated by each practice and nominal maintenance capex requirements, the only logical way to grow the business is to deploy capital to acquire other practices and using the currency of its stock to attract targets.
Valuation
Based on the market capitalisation of S$39.5m and assuming revenue and costs stay constant while HCSS incurs expenses as a listed company – net adjusted profit of S$3,075,082 or 2.1 cents per share (based on post-Placement shares of 146,311,530), the price to earnings (P/E) ratio would be 12.8x.
Enterprise value (EV) based on the pro forma balance sheet which has S$5,194,000 of cash and net cash proceeds raised from the IPO of S$6,147,000, equates to S$28,159,000. On an EBITDA basis, HCSS generated S$3,971,983 or 2.7 cents per share which gives rise to an EV/EBITDA ratio of 7.1x.
With S$4m or 65% of the net cash proceeds earmarked for expansion, HCSS’ business will most certainly grow over the short-to-medium-term, though I am not taking it into account at this point.
If we look at HCSS’ peers as per below, based on the figures as at 30 Oct 2016, we can see that HCSS compares very favourably in terms of the valuation multiples.
Peer comparison

The above peer valuation chart was extracted from KGI Frasers’ initiation report on Health Management International, dated 20 July 2016. Although it is slightly dated, it serves as a quick and good-enough comparison of HCSS’ peers and their valuation. This is since most of its peers’ stock prices have been stable (+/- 5%), sans Health Management International, Singapore O&G and Healthway Medical Corp which have risen much higher in price (which means the multiples are higher), while Cordlife was the only one that declined more than 5%.
As can be seen from the table, the average P/E and EV/EBITDA ratio for the peers, both on a historical (28.0x and 28.6x respectively) and forward (29.2x and 19.7x) basis are miles higher than HCSS’. The direct comparison isn’t exactly accurate since there could be parts of each company’s financials that should be normalised like how my calculations for HCSS was normalised, different capital structure and ROICs generated. Nevertheless, it gives a pretty good gauge of how underpriced HCSS is for the impending IPO when the averages are compared to HCSS’ P/E and EV/EBITDA of 12.8x and 7.1x respectively.
Price to purchase
Some of the peers’ multiples are relatively high and I would be more comfortable taking the average of the 3 lowest peers’ multiple to perform a quick and dirty price calculation to purchase HCSS, without going into a detailed DCF valuation.
On an average forward P/E and EV/EBITDA ratios basis, the average of the 3 peers’ with the lowest multiples are 19.6x and 14.5 respectively. When applied to the HCSS’ adjusted earnings and adjusted EBITDA per share, it would translate to 41.2 cents and 39.2 cents respectively.
Given the clean balance sheet, high ROICs, zero debt, and the simple nature of the business, I would be comfortable with a lower margin of safety of 10%. In other words, my assigned buy price would be about 37.1 / 35.3 cents and below.
Other points
Dividend policy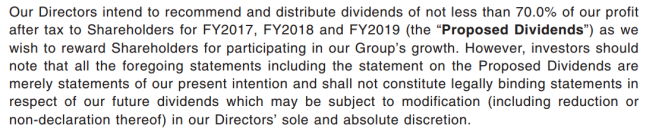
Management’s stake
Following the IPO, the management team will continue to hold a substantial stake, representing nearly 70% of shares outstanding.
Pricing power and business’ susceptibility to technological change
Health-related fields have a certain degree of pricing power, although from time to time, excessive fees charged by doctors and surgeons scrutinised by the regulators. It’s not something I am excessively worried about. My opinion is surgeons’ skills are highly specialised and regulated, and the chances of their livelihood being disrupted by technological change are much lesser than a typical pencil pusher sitting behind a desk. The relatively low capital expenditures on medical equipment as compared to the revenue and operating cash flows generated appears to be a good gauge of this.
Why is HCSS lowballing themselves with a low valuation
HCSS isn’t the first medical-related company to go to IPO with such low valuation. Singapore O&G Ltd, a medial group specialising in obstetrics and gynaecology, was one such IPO. With an IPO price of S$0.25 backed by a low P/E ratio of 9.9x then, it surged 156% to S$0.64 by the end of the first trading day on 4 Jun 2016. Separately, a recent underpriced IPO, Advancer Global which I wrote about prior to their listing and had a P/E ratio of 7.2x, jumped 77% from S$0.22 to S$0.39 on the first day.
Having discussed with several friends, the reasons as to why the bankers and issuer likely leave quite a fair bit of money on the table for IPOs are in my opinion:
- Shares are placed out to friends, staff and family – Issuer would not want to risk damaging relationships and would want them to make money. In any case, if the majority is held by family who owns shares through the placement, the original owners aren’t exactly losing out
- Small stakes placed out – By selling relatively small stakes to the ‘public’, there isn’t much risk of dilution anyway as compared to benefits such as goodwill accrued
The following reasons are more of why they are going for an IPO than why the shares are underpriced.
- Using shares as currency for acquisitions – By IPOing and the strong likelihood of the stock price rising, given the public’s obsession at placing a high multiple on such companies, management can use ‘expensive’ shares in the future for acquisitions and expansion. As such, the dilution by placing out underpriced shares at IPO is probably a small price to pay for such a benefit
- Publicity – They may believe the higher profile of being a listed company provides more clout in attracting talent and customers, which then lead to more business
Conclusion
While on an optical basis, profits have been declining over the past 3 years (without normalisation), it is still a reasonably good business with profit margins in excess of 40%, in a relatively resilient industry. While I am not too psyched up about its growth, the underpricing makes it an attractive opportunity to accumulate shares below 37.1 / 35.3 cents cents per share, providing a margin of safety of 10%. The only thing left to do now is to await for 3 Nov 2016 and see how things go at the opening bell at 9am, to see if the price range is within reasonable limits to purchase some shares. I certainly expect a sharp price increase but will be keeping my fingers crossed nevertheless.